New EV Sales Drop 27 Percent While Used EVs Reach Near Parity, and Charging Infrastructure Expands 34 Percent in Q1 2026
Cox Automotive Data Reshapes Infrastructure Planning as Tesla Model Y, Toyota bZ, and Hyundai IONIQ 5 Lead Against 70 Percent Declines at Ford and Honda
By Keith Reynolds | Publisher & Editor, ChargedUp!
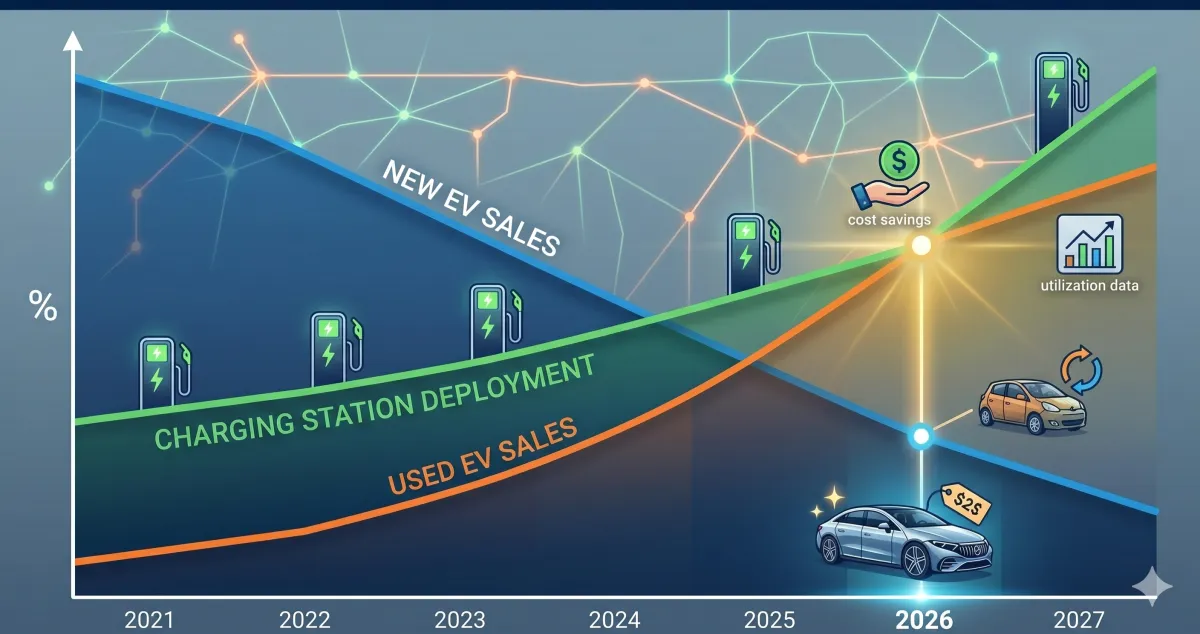
Cox Automotive's Q1 2026 data, released in the March 25 Industry Insights presentation and supplemented in the April 10 EV Sales Report, describes two markets moving in opposite directions. New EV sales landed at 216,399 units, down 27 percent year over year after the $7,500 federal clean vehicle tax credit expired on September 30, 2025. Market share held at 5.8 percent, stabilizing after Q4 2025's 36 percent year-over-year decline. Used EV sales reached 93,500 units, up 12 percent year over year and up 17 percent from Q4. The average used EV transaction price fell to $34,821, just $1,300 above the $33,487 average for used internal combustion vehicles. Two years ago that gap exceeded $10,000. In February, 44 percent of used EV transactions closed below $25,000. Used EVs now move off dealer lots in 42 days, four days longer than gas vehicles.
The charging infrastructure data moved in the opposite direction. According to Cox and supporting analysis from the EV charging industry, 605 new public high-speed charging stations opened in Q1 2026, a 34 percent increase year over year. Public charging sessions totaled 141 million entering 2026, up 30 percent year over year. The two data streams, falling new sales and rising charging utilization, describe a market that is maturing into its operational phase. The question for site owners is no longer whether EV charging demand exists, but whether the specific site is positioned to capture the segment of that demand that is actually growing.
Why the Used EV Market Is the Right Planning Anchor
For multifamily, workplace, retail, and fleet-adjacent properties, the used EV market is the correct infrastructure planning anchor, not new EV projections. Roughly 50,000 electric vehicles per month will return from leases throughout 2026, climbing to total monthly lease return volumes of 240,000 vehicles by 2028 with EVs comprising approximately 20 percent. That is the demand curve charging site owners should underwrite against. The 34 percent year-over-year growth in high-speed station deployment confirms that infrastructure investment is tracking the operating fleet rather than new-vehicle sales projections.
The near-parity price signal is the more important data point for multifamily owners. When the used EV premium over used internal combustion has compressed from $10,000 to $1,300 in under three years, EV ownership has moved into rental populations that were previously priced out of new EV purchases. That changes the underwriting question from whether to install Level 2 charging at a new lease-up to whether the existing stabilized property needs a retrofit. It also changes the tenant retention calculation, because renters with EVs and no home charging are materially more likely to move to a building that solves the charging problem.
For planners, the NYSERDA PON 6150 deadline of June 23 and the $885 million FY2026 NEVI apportionment across nine opened state rounds mean public funding availability remains strong through calendar 2026. Charging infrastructure continues to be one of the few federal programs with predictable near-term disbursement timelines. Applications that close in Q2 and Q3 will drive site construction in 2027 and 2028, which aligns with the lease return wave rather than the new-sales downturn.
Brand Concentration Changes the Site Plan
Tesla returned to 54.2 percent of U.S. EV market share in Q1 2026, selling 117,300 units, with 117,300 representing more than every other automaker combined. The Model Y alone accounted for roughly one in three EVs sold nationwide at 78,591 units, up 22.7 percent year over year. The Model 3 added 31,672 units despite a year-over-year decline near 40 percent. Together the two vehicles represent more than half of all EV sales in the country in Q1. The Cybertruck held ninth overall among all EVs with 3,519 units.
Outside Tesla, Toyota was the quarter's sneaky winner. Toyota bZ sales jumped to 10,029 units, up 79 percent year over year, making the bZ the top non-Tesla EV and the first Toyota EV to reach meaningful volume in the United States. Lexus RZ added 4,456 units, up 207 percent. Hyundai IONIQ 5 delivered 9,790 units, up 13.7 percent year over year, with Hyundai brand EV sales growing 40 percent between February and March. Chevrolet Equinox EV reached 9,589 units. Cadillac, Rivian, and Lucid each delivered year-over-year growth. Rivian grew 21 percent to 10,365 total units.
On the other side of the ledger, the declines are significant. Audi fell 90 percent. Honda fell 65 percent. Ford fell 70 percent with just 6,860 units sold, its lowest quarterly EV volume since 2023. Kia fell 40 percent. Chevrolet fell 30 percent in aggregate, with the Blazer EV collapse offsetting the Equinox's strength. The brand concentration has implications for charging specification. Charging site owners with Tesla NACS connector capability should plan for continued concentration on that standard. Properties without NACS capability risk serving a shrinking share of the operational fleet, because the Tesla Supercharger network opened to third-party NACS-equipped vehicles remains the largest public DC fast charging network in the country.
The Infrastructure Planner's Short List
Dealerships responding to OEM certification requirements, most visibly Ford's Model e Certified program, add another demand source tied to franchise-level infrastructure investment that property owners can ride. Service bays, curbside Level 2 installations, and dedicated DC fast chargers at dealerships produce a consistent load profile that utilities can plan around, and the dealer-adjacent retail property benefits from the halo.
Recent volatility in fuel prices driven by the Middle East has pushed additional shopping traffic to Cox Automotive's Kelley Blue Book and Autotrader sites. Cox's own analysts caution that shopping traffic is a weak predictor of near-term sales movement. A meaningful shift from shopping to purchasing typically takes multiple quarters of sustained fuel price elevation before it shows up in registration data. The more reliable signal remains the lease return wave, the used-vehicle pricing compression, and the continued expansion of high-speed charging infrastructure, all three of which point to the same conclusion. EV charging is moving from a speculative amenity to a building system, and the assets that underwrite accordingly over the next 18 months will capture the rent.
Sources and Further Reading
ACT News, "The United States of NEVI" (FY2026 apportionment) https://www.act-news.com/news/the-united-states-of-nevi
Cox Automotive, "EV Sales Decline Slows in First Quarter of 2026" (April 10, 2026) https://www.coxautoinc.com/insights/q1-2026-ev-sales-report-commentary/
Cox Automotive, Q1 2026 Industry Insights and Sales Forecast Call Presentation (March 25, 2026) https://www.coxautoinc.com/wp-content/uploads/2026/03/Cox-Automotive-Q1-2026-Industry-Insights-and-Sales-Forecast-Call-Presentation-March-2026.pdf
Electrek, "New EV sales drop 28% in Q1 2026, but used EVs surge 12% to near-record levels" https://electrek.co/2026/03/27/used-ev-sales-boom-new-ev-sales-drop-28-percent-q1-2026/
Inside EVs, "5 Takeaways From Q1's EV Sales In The U.S." https://insideevs.com/news/792992/q1-electric-car-sales-2026/
NYSERDA, PON 6150 National Electric Vehicle Infrastructure Program https://www.nyserda.ny.gov/All-Programs/Charging-Station-Programs/National-Electric-Vehicle-Infrastructure-Program
